AS-C validated: 85 days in EV charging stations
Four temperature/humidity sensors, three EV charging stations, 24,385 readings at 5-minute intervals. In the unit equipped with two AS-C strips, time spent in the condensation zone is divided by 2.6, relative-humidity variability by 3, and correlation with outside humidity drops to 0.02. No energy, no maintenance, with 0.32 m² of active surface.
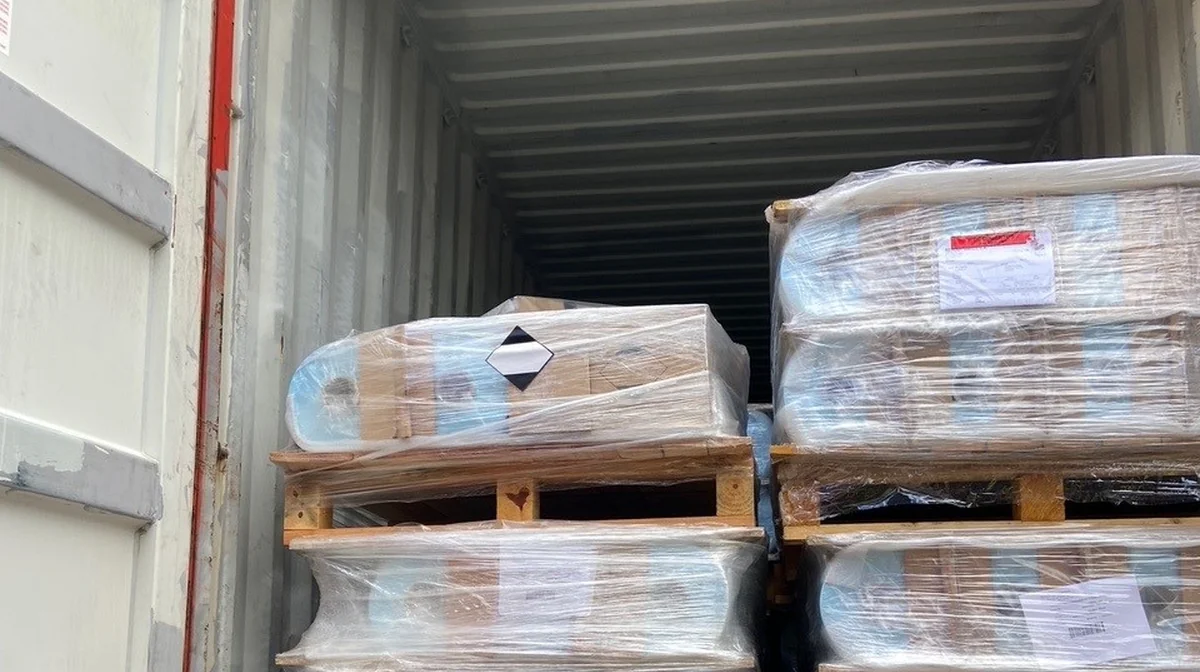
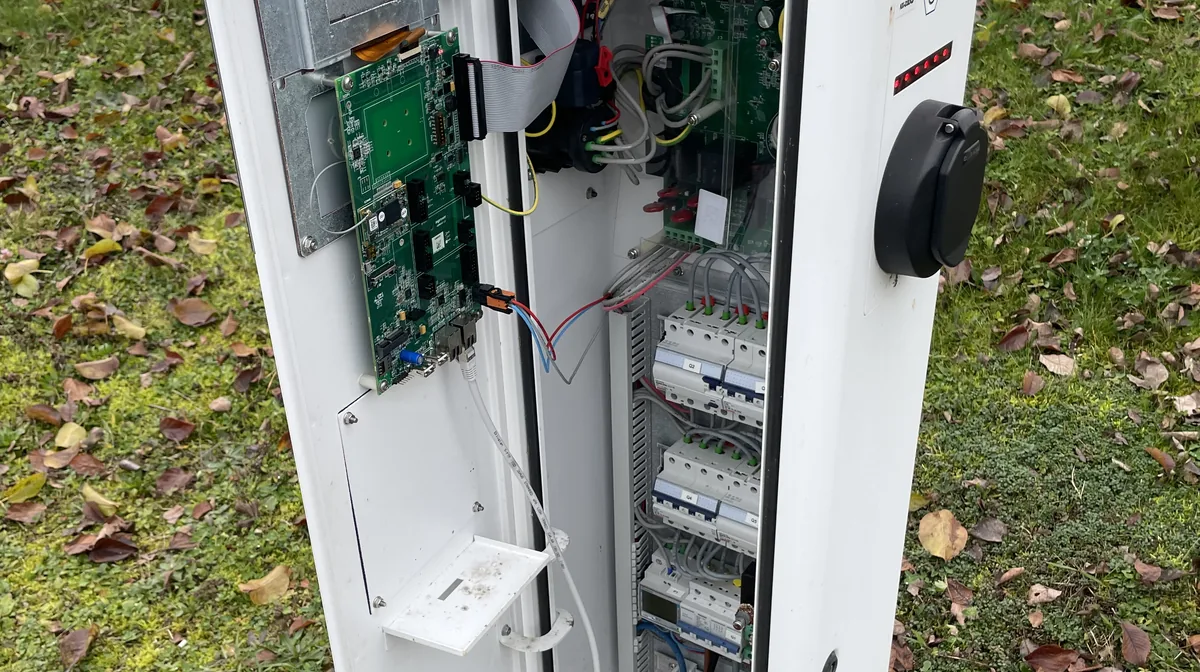
EV charging stations are not hermetic
Three stations were instrumented with a T/RH sensor logging at 5-minute intervals from January 6 to April 20, 2026. On the two control stations (Next5, Next6), not equipped with AS-C, internal RH spends 38 to 60% of the time above 90%, and 11 to 13% above 95%. This last range corresponds to the condensation zone on cold walls and components — the one that degrades seals, initiates corrosion on boards and drifts embedded sensors.
What explains this internal water-vapor build-up is the enclosure’s thermal breathing. The daily temperature amplitude measured inside the stations is approximately 14 °C. It drives a daily expansion/contraction of the internal air of roughly 5% of the volume, which exchanges with the outside through gaskets, cable glands and every other mechanical pass-through. IP65 qualifies protection against liquid water splashes; it does not qualify water-vapor exchange, which follows its own regime, governed by molecular diffusion through the seal and by the amplitude of thermal cycles.
If air gets in, the question is no longer “how to prevent it” — it is “how to condition it”. That is what we tested in station Next7.
Protocol
The protocol was designed and deployed with NEXTENEO, an EV charging station operator that provided three identical stations from its fleet along with an on-site outdoor reference. We thank them for the field access during the 2025/2026 winter period.
Four sensors:
- Next5Ext — outdoor reference, on site.
- Next5, Next6 — inside two unequipped charging stations.
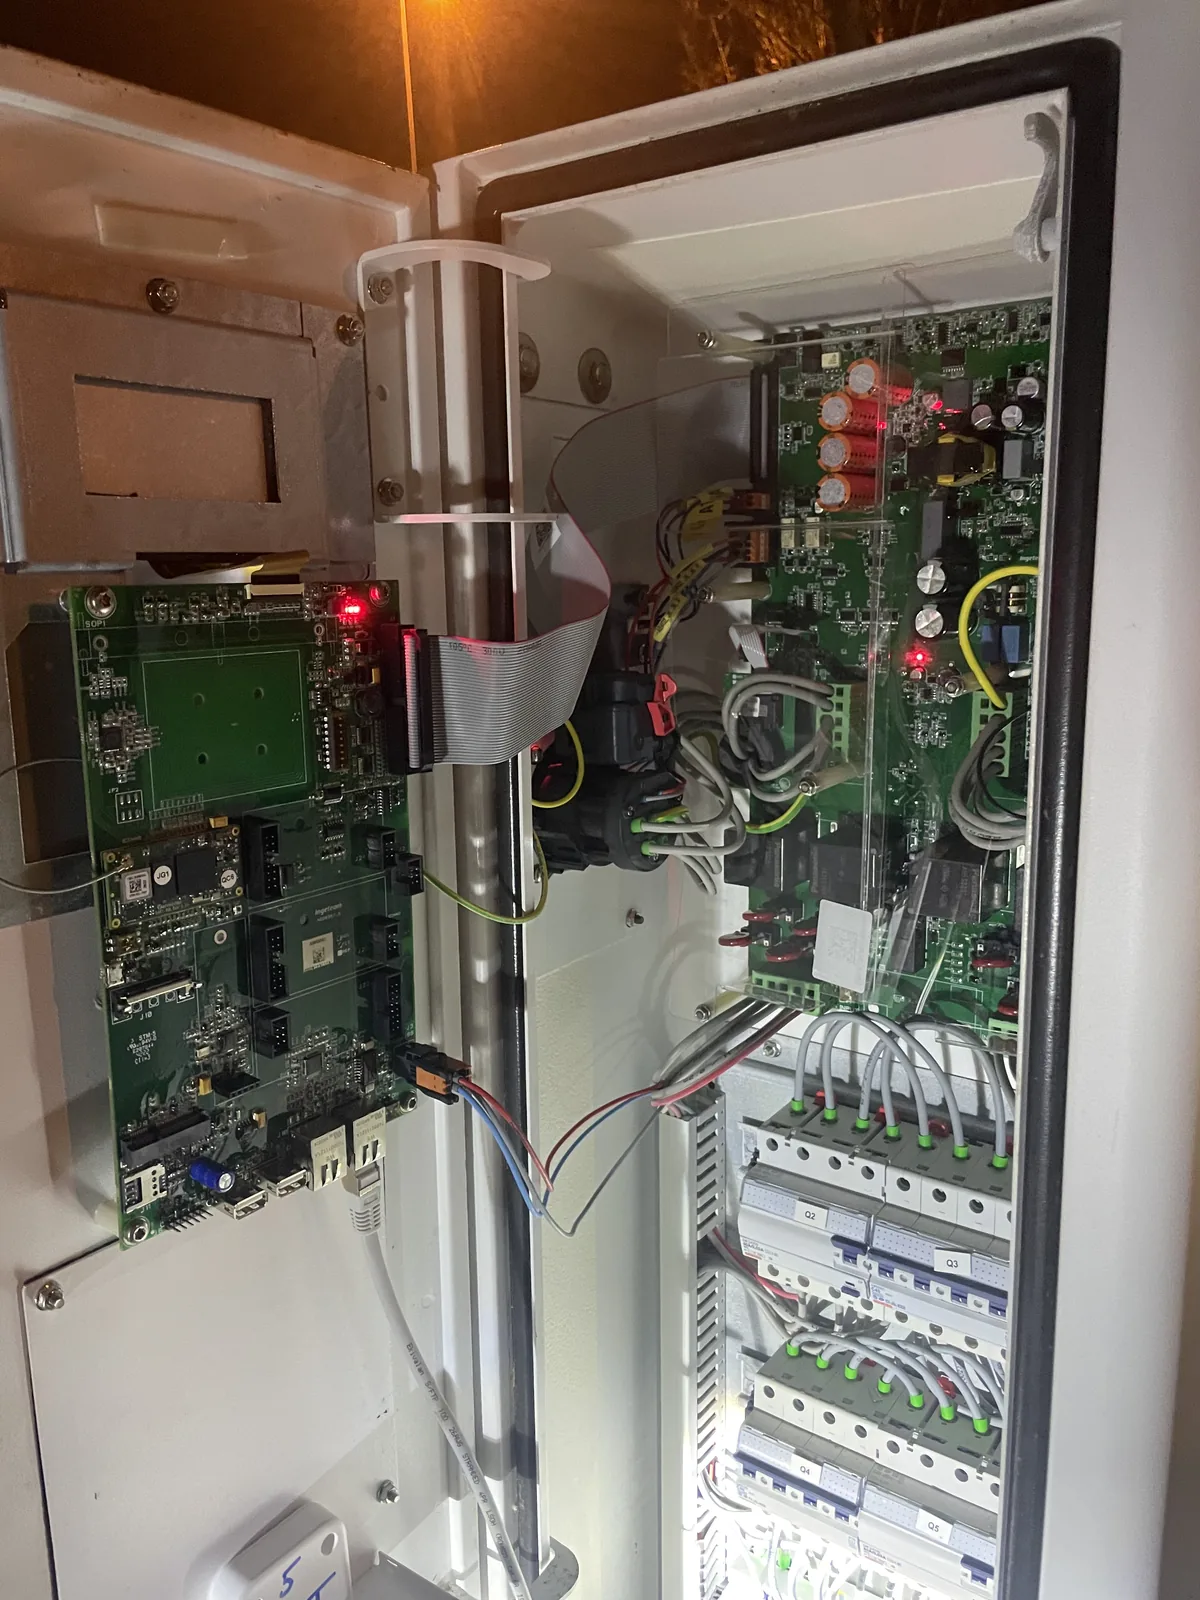
- Next7 — inside a station identical to Next6, equipped on January 25, 2026 at 6 pm with two AS-C strips.
Internal volume of station Next7: 1.39 m × 0.22 m × 0.31 m = 94.8 L. Internal surface available for bonding: 1.61 m².
One AS-C strip measures 2.00 m × 0.08 m, i.e. 0.16 m² of active surface. It carries a surface load of 200 g/m² of patented SRD® mesoporous material, i.e. 32 g of SRD per strip. The installation on Next7 therefore represents 0.32 m² of active surface and 64 g of SRD in total.
The post-installation analysis window covers 85 days (Jan 25 → Apr 20), i.e. 24,385 points aligned across the four sensors.
Results — condensation eliminated
Aggregate statistics over the post-installation period:
| Sensor | T mean (°C) | RH mean (%) | σ RH (%) | Dew pt. (°C) | % > 90% RH | % > 95% RH |
|---|---|---|---|---|---|---|
| Next5 (control) | 6.6 | 86.2 | 11.8 | 4.2 | 60.6 | 11.5 |
| Next5Ext (outside) | 8.6 | 80.5 | 20.4 | 4.7 | 54.0 | 22.3 |
| Next6 (control) | 8.2 | 83.5 | 10.8 | 5.4 | 38.1 | 13.3 |
| Next7 (AS-C) | 8.5 | 90.2 | 3.55 | 7.0 | 59.2 | 5.1 |
The relevant comparison is Next7 vs Next6: identical stations, same site, mean temperature gap of +0.3 °C. Three effects jump out of the numbers:
- Variability divided by 3. RH standard deviation drops from 10.8% to 3.55%, a 67% reduction. The internal atmosphere of Next7 is stabilized around its equilibrium value.
- Near-complete decoupling from the outside. The correlation coefficient between internal RH and outside RH (Next5Ext) falls from 0.54 on Next6 to 0.02 on Next7. Outside weather no longer shows up inside.
- Time in the condensation zone divided by 2.6. Time spent above 95% RH drops from 13.3% to 5.1%, a −62% reduction. That is the direct indicator of condensation risk on cold components.
Note: the aggregate mean RH of Next7 (90.2%) is higher than that of Next6 (83.5%). The benefit of the two strips is not absolute drying; it is on stability and on the suppression of time in the critical zone. We return to the sizing required to lower the equilibrium RH level in section 6.
The observed mechanism in three phases
The Next7 RH curve reads in three successive regimes.
Phase 1 — Initial drying (J+1 to J+4). In the four days following installation, Next7 internal RH drops to 80%, while Next6 stays at 92-93%. The strips, installed almost dry, adsorb available vapor rapidly. Transient efficiency peak.
Phase 2 — Equilibrium plateau (February to late March). Next7 rises again and stabilizes around 91-93% RH. Next6 follows its own more variable dynamic. The strips have reached their equilibrium load for the (volume, temperature, inflow) triplet of this station; they operate as a buffer around that value. This is what explains the 3× reduction in standard deviation: σ Next7 = 3.55% vs 10.8% for Next6.
Phase 3 — Spring desorption (April). Ambient air warms and dries. Next5Ext drops, Next6 follows (down to 65-75% RH weekly average). Next7 also begins to decline, progressively releasing the stored water while maintaining adsorption equilibrium. This desorption is quantifiable: the dew-point time slope on Next7 is +0.12 °C/day vs +0.04 °C/day on Next6, i.e. +2.3 °C/month gap. That is the direct, quantified signature of spontaneous SRD regeneration.
This third regime is the most important of the three. It demonstrates that the material is not a single-use trap: it captures when vapor is available and releases it when the air dries, maintaining a local equilibrium. Without intervention, without energy, without replacement.
Quantifying exchange with the outside
From the measurements, it is possible to deduce the amount of water captured by the strips over 85 days, and therefore the mean inflow into the station through sealing defects.
Mass balance in Next7, stabilized regime at 90% RH, 10 °C:
- Water in gas phase in the 95 L: ~0.8 g. Negligible.
- Water adsorbed on 64 g of SRD at the typical equilibrium load of mesoporous alumina at 90% RH / 10 °C (≈ 32% w/w): ~20.5 g.
- Total water mass in the system: ~21 g.
Assuming the strips were nearly dry at installation (≈ 5% w/w, i.e. ~3 g residual water), the net mass captured over 85 days is approximately 17 g, i.e. a mean inflow of about 200 mg/day ≈ 74 g/year.
This value characterizes the residual permeability of the considered station — gasket, cable glands, installation conditions. It is not universal. But it is measurable on any enclosure using the same protocol (instrumentation + strips weighed before/after over a few weeks), and from there, sizing becomes deterministic rather than empirical.
Sizing for a target humidity
Assuming a constant inflow and therefore a total water mass to store on the order of 21 g, the mass of SRD required to keep the system at a lower RH is obtained by inverting the adsorption isotherm: the lower the target RH, the lower the SRD equilibrium load, therefore the more material is needed to store the same water at that lower RH.
| Target RH | SRD mass | Number of AS-C strips | Active surface | % of internal surface |
|---|---|---|---|---|
| 80% | 76 g | 2.4 | 0.38 m² | 24% |
| 70% | 94 g | 2.9 | 0.47 m² | 29% |
| 60% | 122 g | 4 | 0.61 m² | 38% |
Reading: the tested setup (2 strips, 0.32 m²) stabilizes the atmosphere around 90% RH and eliminates the condensation zone. To target drying at 60% RH — a commonly retained threshold for long-term protection of electronic components — four strips would be needed, i.e. 38% of the available internal surface.
This table recomputes for each enclosure geometry and each measured inflow.
Scope — from one station to other infrastructure
The framework demonstrated here — stabilization, decoupling, reversible desorption, sizing from measured inflow — is not specific to EV charging stations. It applies to any semi-sealed IP6x enclosure that breathes with thermal cycles and contains components sensitive to corrosion or condensation.
So Sponge lists on its infrastructure page seven environments of this profile: industrial electrical cabinets, storage containers, EV charging stations, street furniture, automatic barriers, telecom shelters, outdoor cash boxes. The physics is the same everywhere: an enclosure, imperfect seals, a diurnal thermal amplitude, internal electronics whose reliability declines with time spent in high RH.
The method demonstrated on Next7 transfers directly:
- Instrument the target enclosure with a T/RH logger for a few weeks.
- Characterize the inflow via mass balance on one or two AS-C strips placed during the instrumentation window (precise weighing before/after).
- Size the active SRD surface for the target RH, from the table above adjusted to real volume and measured inflow.
For operators managing large fleets — EV CPOs, telecom operators, street-furniture managers, industrial fleets — a reference sizing can be defined per equipment family from a few pilot sites, then deployed at scale.
Next steps
Two AS-C strips were enough, in an IP65 95 L station, to nearly eliminate time spent in the condensation zone, divide internal humidity variability by three, and decouple the station’s atmosphere from outside variations. The material’s spontaneous regeneration is observed directly at the end of the period, via the dew-point slope gap between Next7 and the control.
The next two steps are the fine characterization of the SRD isotherm to harden the sizing charts, and replication of the protocol on other enclosure types of the infrastructure segment.
EV charging station operators, fleet maintainers, insurers and managers of semi-sealed infrastructure who would like a pilot test on a volunteer piece of equipment can contact us or browse our AS-C range.
Raw data (4 × CSV at 5-min interval) and calculation scripts (asc_analysis.py, dim_asc.py) available on request for reproducibility.